
How to get the IBD50 list for FREE
Introduction
The Investors’ Business Daily is a newspaper covering the stock market, set up by William O’Neil in 1984. One of the most famous things that come from IBD is the IBD 50 - a list of the top 50 stocks that have been screened by the CAN SLIM method. The CAN SLIM method is a stock fundamental and technical screening methodology that was developed by William O’Niel.
So, one can do the screening manually using the methods described OR one can subscribe to the IBD. As part of one’s IBD subscription, one would receive the weekly updates of the IBD 50. But, what if one just wants to know the IBD 50 without having the rest of the perks that come with an IBD subscription? Well, in 2015, innovator ETFs released an ETF (ticker: FFTY) that tracked the IBD50! And since the holdings of the ETF are available publicly, we can just scrap the holdings of FFTY in order to know each week what holdings are recommended by the CAN SLIM method
Disclaimer: An IBD subscription, I’m sure, comes with a lot more than the IBD50. This is merely a subset of what the subscription offers and so please feel free to subscribe to the full IBD if you find it helpful! For me, I felt I just needed the IBD50 list
Scrapping Process
Problems with BeautifulSoup

So, we all know that BeautifulSoup is the go-to when scrapping the web. However, I needed to scrap from zacks.com and the issue with that is that zacks.com stores the “holdings” in a JavaScript table. The second issue is that the initial page only displays 10 entries (out of the 50 stocks that are recommended under the IBD50 list), You can’t really manipulate the webpage address to show the rest because, again, the holdings are stored in some JavaScript table. It was time to turn to the other favorite tool - Selenium
Loading the webpage with Selenium
# Import necessary packages
import requests
import pandas as pd
import re
from selenium import webdriver
from selenium.webdriver.support.ui import Select
from yahoo_fin import stock_info as si
Because I was lazy and did not want to add the geckodriver to PATH (which you can find how to do here), I needed to specify my executable_path. (ps: the R in front is for Python to read it as a raw string and hence ignore the slash)
Once that was done, I simply set the URL for the FFTY holdings and used the driver to open the webpage.
#create driver using FireFox Gecko
driver = webdriver.Firefox(executable_path=R'C:\Users\....\.....\....\....\Random Assets\geckodriver.exe')

#set url for FFTY
url="https://www.zacks.com/funds/etf/FFTY/holding"
driver.get(url)
Accessing a Dropdown box
Once that was done, I needed to access the dropdown list and change it such that it would show all 50 entries. The annoying thing about this was that I kept getting an error that the element (the dropdown box) was blocked and not selectable! It turns out that the “Accept Cookies” form covered the dropdown box when the page initially loaded.
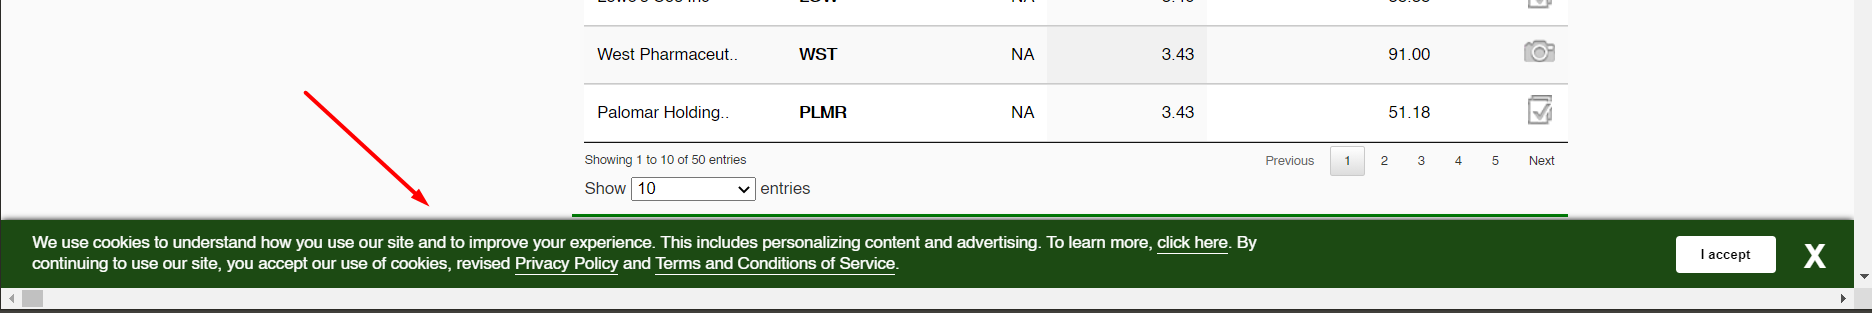
This was easily solved by using window.scroll to scroll it down about 400p (out of 1080p) so that the cookies form was out of the way. With that done, I simply had to find the dropdown box element and select ‘50’
#scroll to the bottom to ensure dropdown list is not blocked
driver.execute_script("window.scrollTo(0, 400)")

#select dropdown list to display all 50 holdings
ddelement= Select(driver.find_element_by_xpath('/html/body/div[5]/div[3]/div/section[2]/div/div/div[3]/div[2]/label/select'))
ddelement.select_by_visible_text('50')
Storing the data
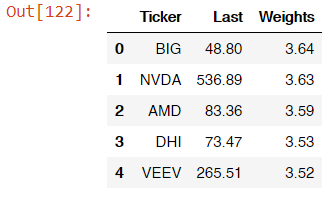
This was the easiest part. After displaying all 50 symbols, I just had to use their CSS selector and pull the ticker symbol as well as their weights in the portfolio. I then used Yahoo Finance to pull their prices (just to make my life slightly easier).
#get ticker names
stock_list = [driver.find_element(By.CSS_SELECTOR, "#etf_holding_table > tbody:nth-child(2) > tr:nth-child({}) > td:nth-child(2) > a:nth-child(2) > span:nth-child(1)".format(i)).text for i in range(1,51)]

#get portfolio weights
weight_list = [driver.find_element(By.CSS_SELECTOR, "#etf_holding_table > tbody:nth-child(2) > tr:nth-child({}) > td:nth-child(4)".format(i)).text for i in range(1,51)]

#get prices
price_list = [round(si.get_live_price(i),2) for i in stock_list]

#create dataframe
df = pd.DataFrame(
    {   "Ticker" : stock_list,
        "Last" : price_list,
        "Weights" : weight_list
    }
)
df.head()
Conclusion
So there you have it! Super easy, super fast way to get the IBD50 list without having to pay for a full subscription if you ever so desire! Thanks for reading!
And, as an aside, a most useless graph showing the distributions of all 50 tickers in a cute pie chart
import matplotlib.pyplot as plt

plt.figure(figsize=(20,20))
plt.pie(df['Weights'], autopct=None, labels=df['Ticker'],
        shadow=False)
plt.show()
